Source: Redfin By Nela Richardson
Homes Sell at Speeds Near 2013 Record; Price Growth Taps the Brakes in MaySales Growth Slows as New Listings Drop by 1.8 Percent
Boston Homes Sold Twice as Fast in May than in April
San Francisco Home Prices Soar 25% From Last Year
Boston Homes Sold Twice as Fast in May than in April
San Francisco Home Prices Soar 25% From Last Year
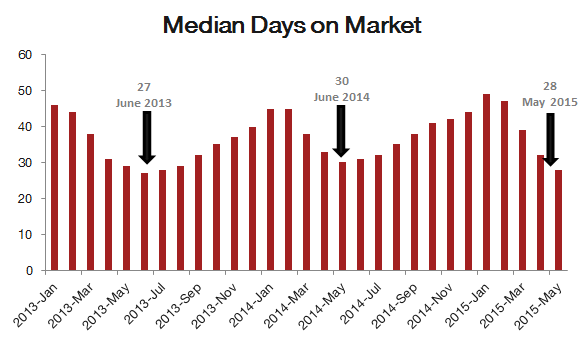
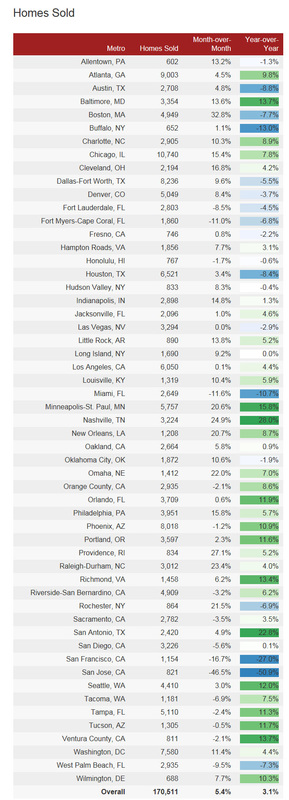
Homes sold at their fastest pace in nearly two years, with the typical property on the market only 28 days in May, down from 32 in April. Last month, 35.6 percent of homes went under contract within two weeks of their debut, just shy of the peak rate of 35.8 percent exactly two years ago.
Home sales across Redfin markets rose 5.4 percent in May from April and 3.1 percent from a year earlier. For the last three years there’s been a double-digit spike in homes sold; this year, an inventory shortage has kept a lid on that growth.
Home sales across Redfin markets rose 5.4 percent in May from April and 3.1 percent from a year earlier. For the last three years there’s been a double-digit spike in homes sold; this year, an inventory shortage has kept a lid on that growth.
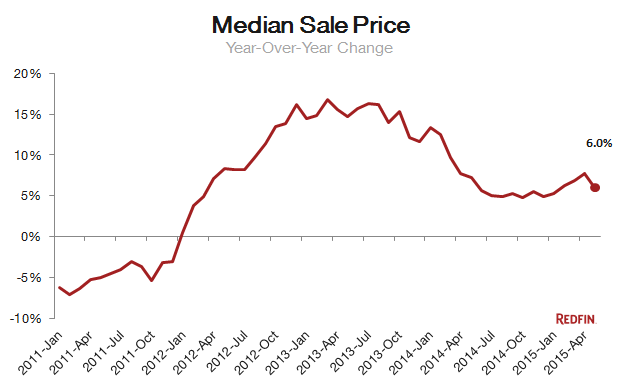
Even as homes sold more quickly, May showed a significant slowdown in month-over-month price growth, up just 1.6 percent. That’s relatively low — in each of the past five years, prices rose at least 3 percent in May. Year over year, the median price was up 6 percent last month to almost $279,900, a marked drop from the 7.7 percent increase in April.
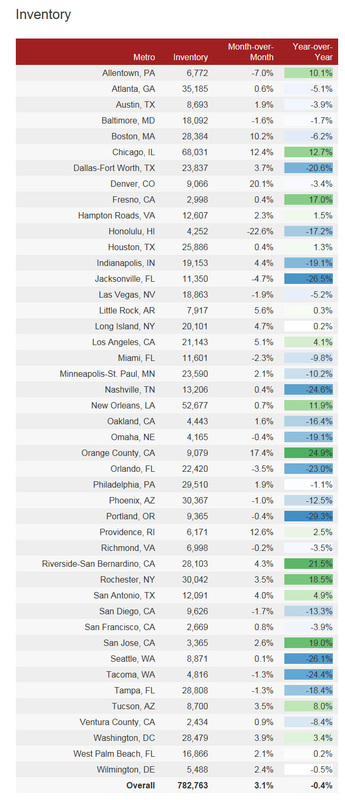
Because of steady buyer demand, inventory has barely budged from last year’s low levels. The number of houses, condos and co-ops for sale in March and April grew by less than 1 percent year over year; they dipped slightly in May.
The composition of buyers — more traditional households and fewer investors — also has kept prices from surging at the double-digit rates seen in 2013.
Other May HighlightsPrices
The composition of buyers — more traditional households and fewer investors — also has kept prices from surging at the double-digit rates seen in 2013.
Other May HighlightsPrices
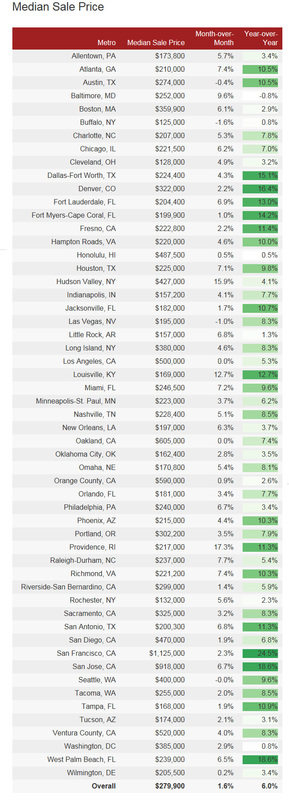
- San Francisco continued its stunning pace of price growth. Median prices accelerated 25% from a year ago, to $1,125 million. Prices in San Jose aren’t far behind, topping $900,000 for the first time, up nearly 19% year over year.
- Four more-affordable Florida markets also posted double-digit, year-over-year price growth: West Palm Beach (18.6%), Fort Myers (14.2%), Fort Lauderdale (13%) and Tampa (10.9%) .
- Minneapolis posted the biggest year-over-year increase in home sales, up 15.8%. Sales surged 20.6% from April.
- Baltimore and Chicago also heated up in May. Home sales in Baltimore rose 13.6% from last month; in Chicago they increased 15.4%. Year over year, sales in Baltimore and Chicago were up 15.8% and 7.8%, respectively.
- Sales in San Jose plummeted an astounding 50.9% from last year. Month over month they fell 46.5% in May, the biggest drop in monthly home sales in at least six years.
- Denver continued its reign as the fastest market in the country, with the typical home staying on the market a mere five days, unchanged from last month. Three-quarters of new listings were off the market in two weeks or less.
- Seattle beat its own record last month, quickening to an average of eight days on the market from nine in April. The number of homes sold above list price increased to 46.5% in May from 43.7% in April. Last year only 37.4% of homes sold above list.
- Boston more than doubled its speed in May, when the typical home stayed on the market just 14 days, compared with the 30-day median recorded in April. In May, 52.4% of homes went under contract within two weeks, up 27.2 percentage points from last year.
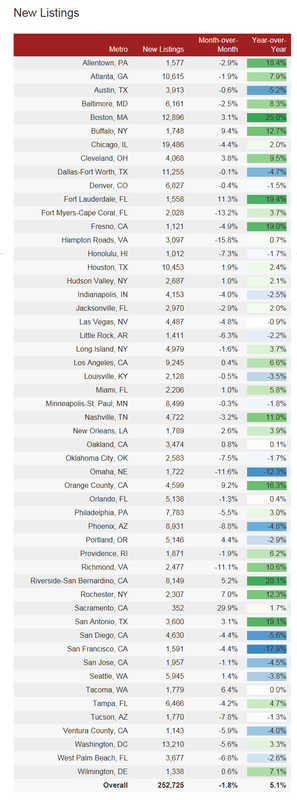
- In May, 32 out of 54 metro areas saw year-over-year growth in new listings, which were up 5.1% overall. Leading the pack were Boston (25%), Riverside-San Bernardino (20.1%) and Fort Lauderdale (19.4%).
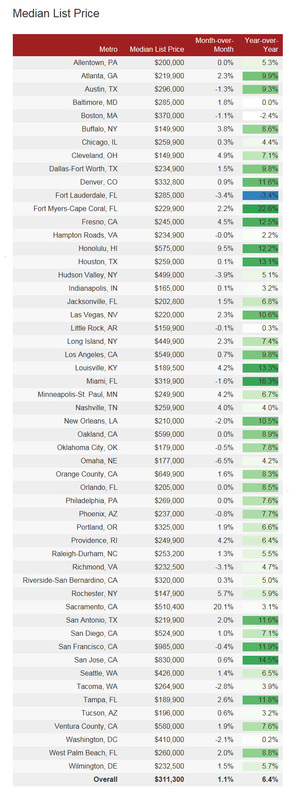
- San Francisco (-17.9%) saw the largest drop in May listings compared to 2014. Inventory was down 3.9% from last year. New listings also dropped significantly year-over-year in San Diego (-5.6%), Phoenix (-4.8%) and Dallas-Fort Worth (-4.7 %).


 RSS Feed


